
A Test Every PPM Market Needs to Conduct Today

By Eric Rhoades
President
![]()
July 28, 2015
.
By now, everyone in the radio industry is probably sick of hearing about the controversy surrounding the Voltair unit, which supposedly boosts PPM recognition in Nielsen’s ratings technology. I’m a little sick of it myself, frankly, yet since Radio Ink raised awareness of this issue, I feel we need to help bring it to a conclusion.
Since Nielsen came out with its client webinar and stated that it does not support the Voltair, the controversy has only been amplified. Stations and broadcasters want to know if it really works. Some very smart consulting people have been chiming in with their analyses — some of which appear to show conclusively that any ratings increases with Voltair are merely coincidental and that it is programming that has led to any ratings change. Voltair, they say, is inconsequential.
I’m not satisfied.
Please understand that it’s not that I distrust these people or their opinions, but I think that as an industry we deserve some independent, third-party science. I say “science” because I believe there must be a scientific research study. A good scientist will set out to find answers, not to prove or disprove a particular theory. Data coming from either Voltair or Nielsen will inevitably raise suspicions, fairly or unfairly. Further, I would think that someone like myself, a former program director and programming consultant, might subconsciously seek to prove that it’s programming that makes the difference, because, well, it’s where I made my living, and I might want to prove that it still matters.
I am not a scientist. PPM technology and how the system works is not my expertise. But I am very curious about this issue. So, based on a theory that a rising tide lifts all boats, I was wondering what the impact of Voltair might be on all boats — all stations in a market. Since no one is going to admit they are using Voltair, and Telos Alliance keeps user names confidential, and since groups like iHeart or Cumulus might purchase the units in bulk and not even tell Telos where they’re using them, it is close to impossible to track actual numbers.
What is not impossible is to look at radio ratings market by PPM market and see what has happened in a market overall. The theory being that the bigger, more prominent stations with the most to gain or lose are the most likely to use Voltair units.
Here is what we do know.
We know which markets are PPM markets.
We know the very first production Voltair units were delivered in June of last year. Non-production units were delivered in April or May of 2014.
Based on statements from Telos Alliance, we know that there is at least one Voltair in use in every PPM market.
So my assumption is that if we look at PPM markets over a long period, Voltair might show an effect on overall radio listening. But in any particular market, there might be some larger reason radio listening would rise, so it’s important to look at more than one market. In fact, it’s important to look at them all.
Here’s the problem.
I’m not a Nielsen subscriber and don’t have access to the data.
I’m not legally allowed to publish Nielsen data other than very basic trending data.
But one advantage of a lifetime in radio is a lifetime of connections, which gave me a chance to take a peek at some data to test this theory.
The result is something I want to share. It’s not conclusive by any means. It’s not even scientific. And once you see what I’ve shared, you’ll see why I follow it up with a very specific call to action to all PPM market stations in America to help me resolve this issue.
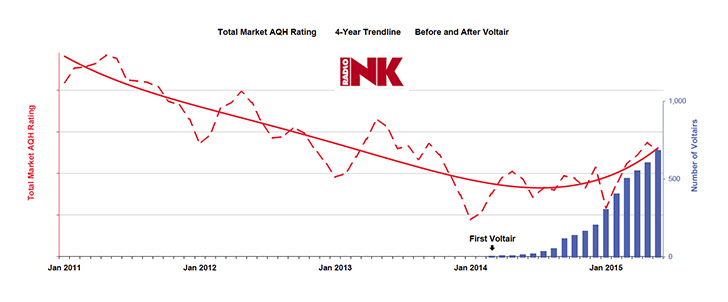
I wanted to see a full-market report (not specific stations) from a market that is rumored to have a lot of Voltair units. I requested AQH (Average Quarter Hour) Rating January 2011 until June 2015, ages 6+.
Here is my challenge: I cannot show you anything specific without violating Nielsen copyrights. Nor can I share where I acquired this data because stations don’t want to risk being labeled Voltair users.
I have not altered the chart at the beginning of this e-mail in any way other than adding a mark indicating “Voltair start” in June of 2014. I cannot say whether changing trends thereafter were a result of Voltair or some other condition or conditions. But, looking at this chart from one market, I am curious about whether this trend exists in other PPM markets.
I was also able to obtain the estimated number of Voltair units in use in the industry overall month by month; that line is shown to the right of the chart.
Note that radio listening was trending down before June 2014. I’m not sure of the reason for that, but I suspect some of it has to do with crediting online listening vs. over the air. But soon after June of 2014, this chart shows that trend reversing.
What do you think?
Important Next Steps for Broadcasters
One market is not a research study. It merely shows that one or more Voltair units may have had an impact, since the upward trend starts after production units were delivered. But what would happen if multiple markets ran this data?
You need to run this test to see if there is a similar trend in your market. To be consistent, run AQH (Average Quarter Hour) Rating January 2011 through June 2015, ages 6+.
I do not have access to PPM data. You do. You have the ability to share your data with others as part of your PPM agreement.
If every station using PPM were to run the exact same report and share it with me, I’ll be able to see if there is a trend, market by market, across the U.S.A. I’ll find a way to report that data. I should be able to show all the different markets I receive, even if I do not label them specifically so I don’t violate Nielsen copyrights. You can e-mail a screenshot of your market trend to me:
er**@ra******.com
. I will not use the market name, you will remain anonymous, and you don’t have to be a Voltair user — I don’t want to know.
If stations cooperate and share this data, I’ll prepare an overall view, market by market, with generic labels on the data. Please use the exact criteria stated above.
What’s Next?
Ultimately the industry must have a third party, unrelated to either Telos Alliance or Nielsen, test this further. We need a panel of credible experts who have no link to either company. I’m told by some that there is no way to find a conclusive answer because of frequent format changes and other programming factors. But it seems that looking at total radio listening, market by market, is a good start. And I believe a real, scientific solution does exist.
I’ll look forward to receiving your confidential e-mail and to your sharing your exact market report (based on the stated criteria).
Disclosure: Nielsen is a paying advertiser in Radio Ink and Telos Alliance is not. Radio Ink understands that we are placing our advertising at risk by revealing these concepts.
Streamline Publishing, Inc., 1901 S. Congress Ave., Ste. 118, Boynton Beach, FL 33426
Website: RadioInk.com


